Non fatal injuries in the US cost around $1.8 trillion every year , part 1


What does an injury really cost, not only in terms of medical spending but also in terms of work loss and decreased quality of life? A recent study by researchers from Brown University and the Pacific Institute for Research and Evaluation and published in the Journal of Injury Epidemiology provides an economic analysis of the “real cost” of all 31,038,072 hospital-treated injuries in the US in 2013. While most previous studies on injury cost focus mostly on the acute medical cost they don’t address the cost of the burden of injury.
The study found that one American out of 10 visited the hospital for a non-fatal injury during the year under study. Medical spending including hospital and home care, emergency transportation, medicines and physical therapy for all of them came to a total of $168 billion. Future lost work from permanent disability came to a total of $223 billion and quality of life loss came to a total of $1,46 trillion.
The study also provide an in-depth analysis of the cost of injury by age, household income, payer, location, injury mechanism, intent and severity.
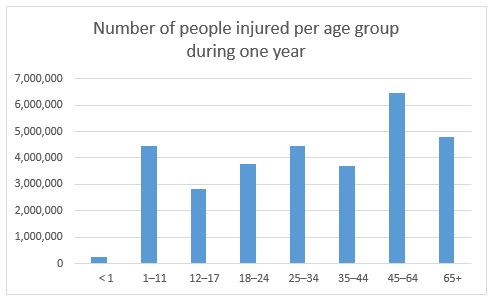
More than 6 million people aged 45 to 64-year-old were treated for injury in 2013. People over 65-year-old as well as children 1 to 11-year-old and young people 25 to 34-year-old were among the most at risk of being injured. For each of these age categories between 4 and 5 million of them were hospitalized to be treated for injury. On the graph below the 45 to 64-year-old category shows the highest number of injuries however the category covers a 20 year age range while most categories have a 10 year age range which makes comparison difficult.
Again when comparing the cost of injury per age group, the age groups that are costing the most are the 45 to 64-year-old and the 65+ but again these two categories cover a larger range of years than the others.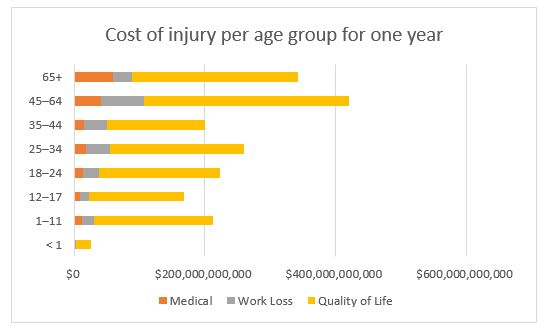
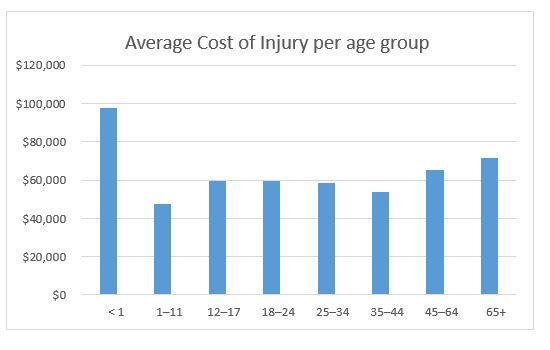
The average cost of injury per age group which is the total cost of injury for one category divided by the total of people injured in that category allows for equal comparison of all categories. On average, babies less than one year old are the one that are the most expensive to treat and care for when they are injured. An average baby injury costs $97,623. The second most expensive injuries are those occurring to seniors above 65-year-old with an average cost of $71,493. Children age 1 to 11 have the lowest average cost of injury at $47,663.
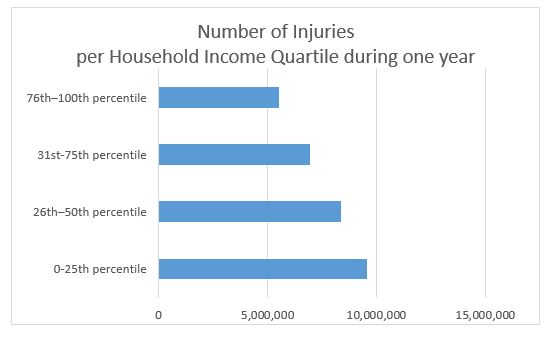
The study also compares the number and the cost of injuries to the Household Income Quartile and shows that the lowest income group is the group with the highest number of injuries and the highest income group has the lowest number of injuries.
Does this mean that poor people have a higher risk of being injured than rich people? Not at all. There are just more poor people than rich people in the US population. The graph below shows the distribution of income in the US
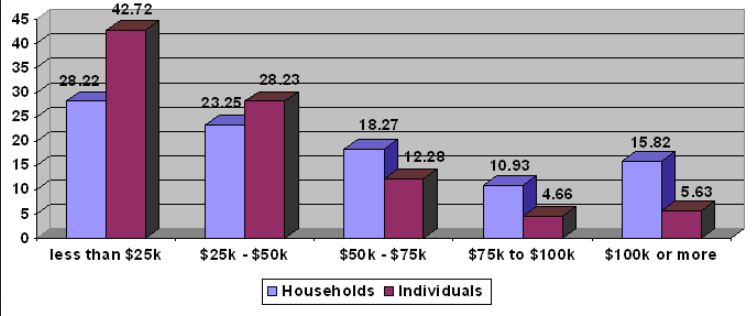
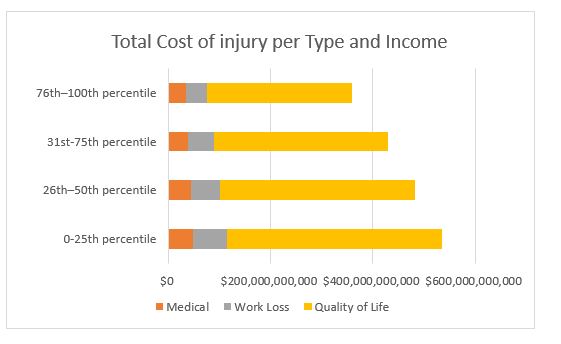
The total cost of injury per household income quartile also follow a similar distribution, with the highest costs occurring in the lowest quartile and the lowest costs occurring in the higher quartile. Again this result is highly correlated with the income distribution among the population.
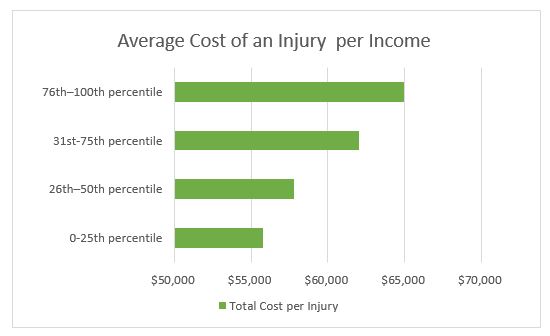
When looking at the average cost of an injury per income, an injury suffered by someone in the highest income quartile will cost in average $10,000 more than an injury suffered by someone in the lowest income quartile.
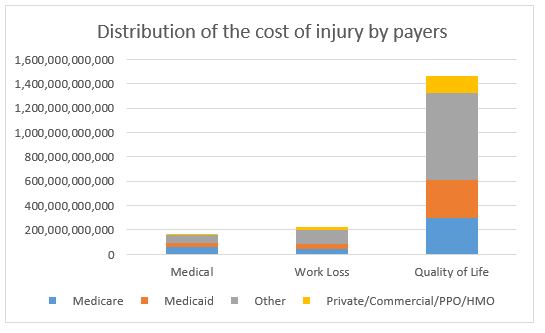
Who pays the bill? The study categorizes almost half of the payers under “other” which is not helpful. Another quarter is paid by private and commercial insurances as well as PPO and HMO. Medicaid and Medicare pay for the other quarter with Medicare paying for a bigger chunk than Medicaid.
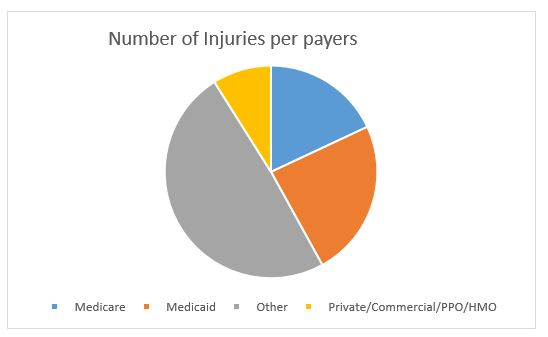
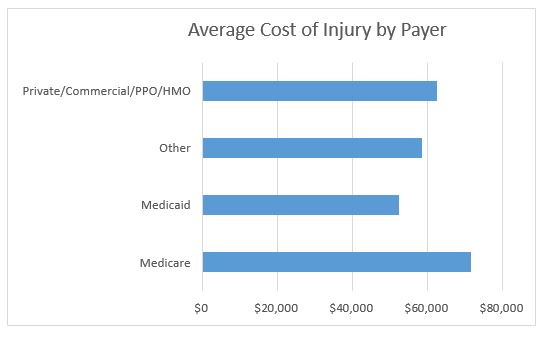
On average Medicare will be charged more for an injury than the other category of payers. On average Medicare pays $71,501 for an injury while private and commercial insurances as well as PPO and HMO pay $62,504 and Medicaid $58,269.
There is no difference between the cost of injuries occurring in rural areas or in urban areas. 80% of the injuries occurred in urban areas and 20% in rural areas which is mirroring the distribution of the US population between rural and urban areas.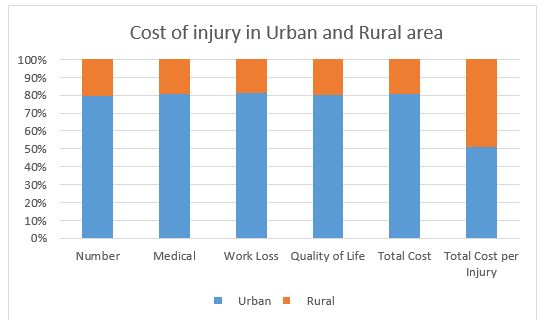
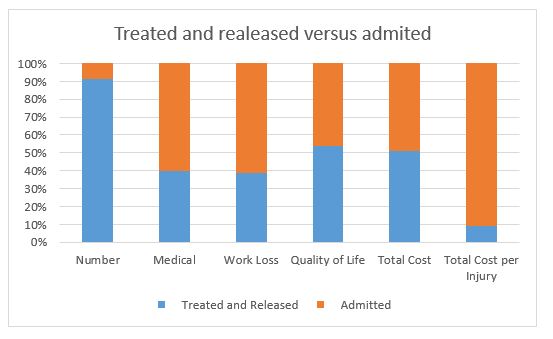
90% of the people visiting the hospital for injury are being treated and released immediately and 10% have to be admitted. Globally the total cost of the injuries sustained by those who were released is the same as the total cost of the injuries sustained by those who were admitted. While looking at the individual cost, the cost of injury for someone who was admitted is 9 times higher than the cost of injury for someone who was treated and released.
Almost 90% of the injuries are minor. These injuries account for approximately 60% of the total cost of injury. The most expensive injuries are those that have a severity score between 5 and 14. They are the less common ones but also the most expensive ones. They are even more expensive than those that have a severity score above 15 and suffer major trauma.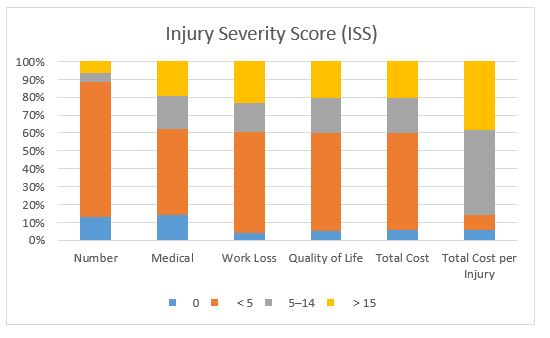
In a next blog we will look at injury types and their related cost.