To reduce car accidents deaths, The US Department of Transportation applies Vision Zero principles at national level


 An estimated 42,915 people died in crashes in the US in 2021.Traffic accident fatalities which had been on a declining trend for 30 years started to increase since 2020. Last year, the US DOT announced that it would apply the Vision Zero concept nationally to tackle this problem.
New Yorkers are familiar with Vision Zero which started in 2014. The program was successful at the beginning but got out of hand since the Covid19 crisis. The program was good at identifying dangerous corridors and areas that needed improvements but the implementations of safety measures in dangerous areas, especially those located in historically disadvantaged communities remained too often unrealized. As a result, most road fatalities in New York City still occur in dangerous areas that had been identified as such almost 10 years ago. Just like in 2014 in New York City, the US DOT did some outstanding in-depth research and developed amazing interactive maps to point out dangerous areas in each community of the entire country.
The work of the DOT is extremely impressive:
- A first map identifies precisely every location where someone died in a crash between 2016 and 2020 and when clicking on the location, one can find out the date of the crash, the estimated time, the day of the week, the number of fatalities at the location of the accident, the number of pedestrians involved, the number of vehicles involved, the type of roadway and a Google map link to the location of the accident.
- The second map compares the number of roadway fatalities by county with the national average of 59 roadway fatalities by county between 2016 and 2020. The US DOT found that the 50 counties that have the highest fatality rate in the country accounts for almost a quarter of all fatalities. Among them one is located in NY State: Suffolk county with a number of fatalities 10.3 times higher than the average county, however it is a very large county.
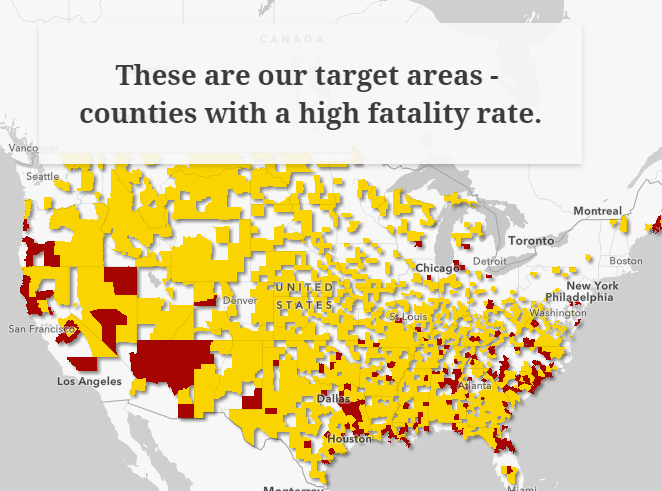
- The third map looks at the fatality rate by county and differentiates counties with a high or low population and high and low number of fatalities. Again the map is extremely detailed with the size of the county, the population number, the fatality number and the fatality rate allowing the DOT to identify target areas. None of them are in New York State.
- The fourth map is a similar analysis at municipality level.
- A fifth map goes even deeper and explores fatalities and equities and found that half of the communities in the top 20% of roadway fatalities are historically disadvantaged.
- The last map looks at the municipalities that did well and reported a minimal amount of fatalities during the period under review.
Infographic source: U.S. DOT