NYC auto accident deaths at their lowest, personal injuries at their highest over the first semester of 2017


96 people died and 27,923 suffered personal injuries in 110,992 motor vehicle accidents in New York City during the first 6 months of 2017 based on the most recent statistics released by the NYPD.
This is the first time that the number of people dying in NYC traffic accidents during the first six months of the year is below 100. In 2013, before Mayor de Blasio launched Vision Zero, 121 people died in auto accidents in the city during the same period. Vision Zero was launched at the beginning of 2014 and since then the total number of people dying in NYC crashes slowly decreased from 110 during the first semester of 2014 to 107 during the first semester of 2015 and the first semester of 2016. It dropped to 96 for the same period of 2017. Multiple Vision Zero measures such as the reduction of the city speed limit to 25 mph as well as the installation of cameras may have contributed to this decline in fatal crashes.
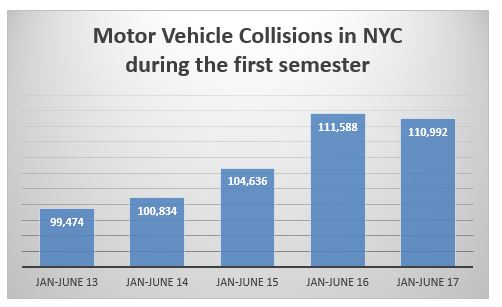
The decrease in traffic deaths in New York City occurred despite a significant increase in crashes over the last 4 years. In 2013, 99,474 crashes were reported to the NYPD during the first semester. This number increased steadily to 100,834 in 2014 and 104,636 in 2015. It then jumped to 111,588 in 2016. It decreased slightly during the first six months of this year to stabilize at 110,992. Distracted driving is the most common factor in these accidents.
While fewer people are dying in car accidents in New York City, more are getting injured. 26,119 people sustained personal injury in a motor vehicle accident during the first six months of 2013 compared to respectively 24,508, 23,530, 27,540 and 27,923 during the same period of 2014, 2015, 2016 and 2017. The number of injuries sustained in traffic accidents in the city first decreased during the first two years of Vision Zero. They jumped back above the 2013 level for the last two years.
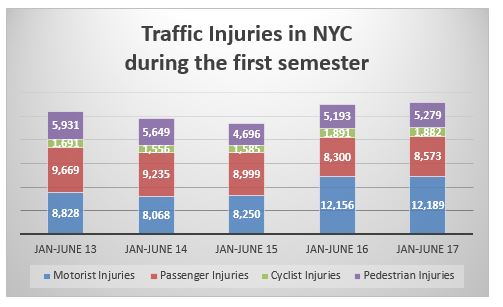
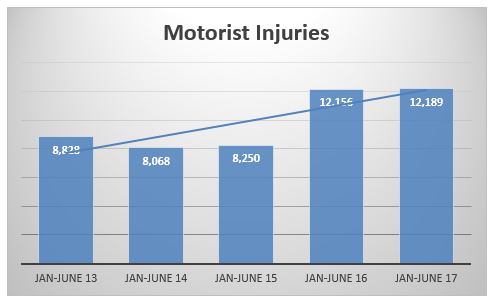
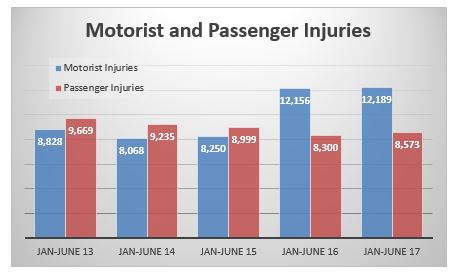
The graphic above clearly shows that the increase in personal injuries occurred mainly in the motorists (drivers) category. The number of motorists injured in car accidents increased by almost 28% over the last 4 years. After declining from 8,828 during the first six months of 2013 to 8,068 during the same period of 2014, the number of injuries sustained in crashes in NYC slightly increased to 8,250 during the first semester of 2015. For the first six months of 2016 and 2017 , the number of injuries jumped to respecitvely 12,156 and 12,189.
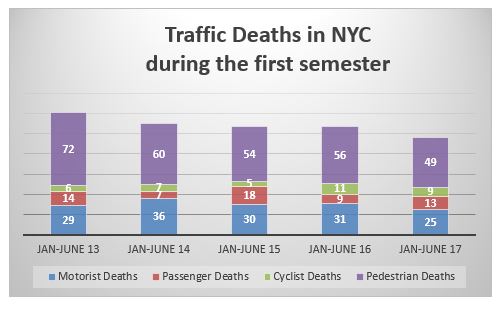
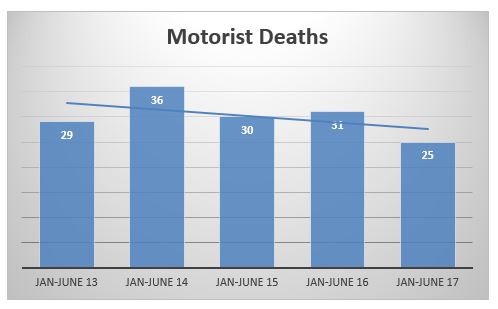
While motorist (driver) injuries increased by 28% during Vision Zero, motorist deaths decreased by 16% during that period. However the decline in motorist deaths during the first semester didn’t occur gradually. Indeed since Vision Zero started, it is the first time in 2017 that the police recorded a decline in motorist deaths over the first six months of the year. The year before the launch of Vision Zero, 29 motorists died in crashes during the first semester. During the first year of the program, 36 of them died during the same period. The number went down to 30 and 31 respectively for the same period of 2014 and 2015 but stayed above 29. It is only this year that the motorist deaths significantly declined for the first semester of the year and changed the trend to a positive one.
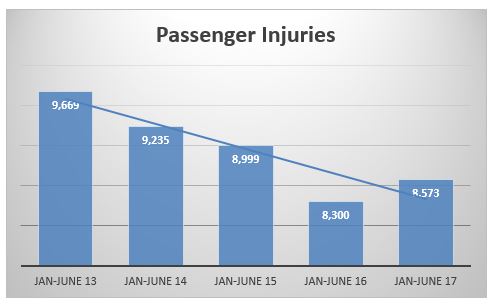
Less and less vehicle passengers are injured in crashes. In the past (see data for 2013, 2014 and 2015) the number of passengers injured in crashes was higher than the number of motorists injured in crashes. It was the opposite during the last two years: there were more drivers than passengers injured in auto accidents in the city. Could the usage of smartphones and other electronic technologies by drivers alone in their car play a role in this somewhat surprising change?
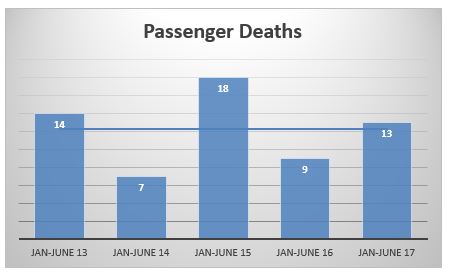
The number of passengers dying in crashes in the city during the first six months of the year decreased by half from 14 to 7 between 2013 and 2014 before jumping back to 18 in 2015 and decreasing by half again in 2016. Passenger deaths increased again to 13 in the first semester of this year. Globally the trend is stable.
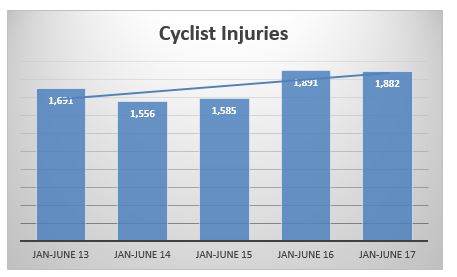
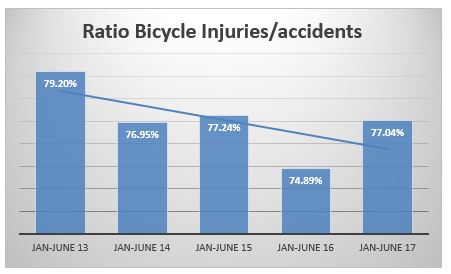
Over the last two years the number of bicyclists injured in crashes in New York City during the first semester of the year was significantly higher than the 3 previous years. In 2013, before the launch of Vision Zero, 1,691 bicyclist injuries were reported to the NYPD. After the launch of Vision Zero, this number went down to 1,556 in 2014. It slightly increased to 1,585 in 2015 and jumped to 1,891 in 2016. This year it was almost stable, down 9 compared to last year but still very high compared to all the other years. Globally cyclist injuries are on the rise despite the addition of protected bike lanes and the introduction of various other Vision Zero safety measures all over the city. On a positive note, the ratio of injuries compared to accidents is on a declining trend.
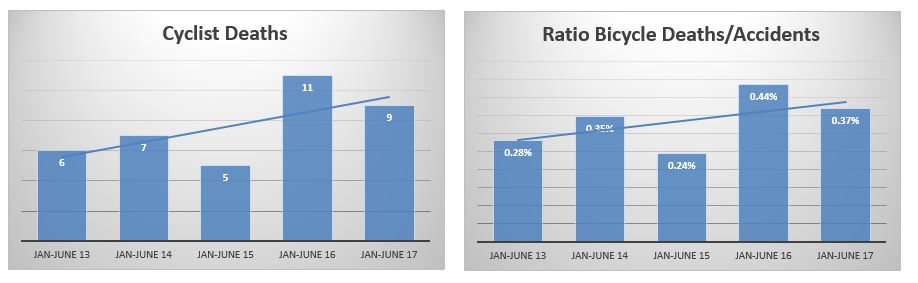
Cyclists deaths were also much higher during the first semesters of the last two years than during the same period of the 3 previous years. In 2013, 6 cyclists died in a crash in New York City compared to respectively 7, 5, 11 and 9 during the first semesters of 2014, 2015, 2016 and 2017. Even more concerning, the ratio of bicyclists deaths compared to bicycle accidents during the first semester of each year is on a rising trend. This ratio indicates that despite the many Vision Zero safety measures the streets of New York City became more dangerous for bicyclists over the last two years . A comprehensive study of cyclist safety created by the Department of Transportation (DOT), the New York City Police Department (NYPD) and the Department of Health and Mental Hygiene (DOHMH) was recently released by the Mayor’s office.
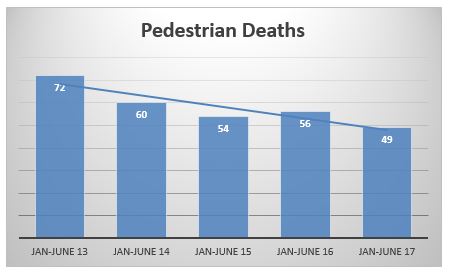
Pedestrian deaths were at their lowest during the first semester of 2017. It is the first time that they were below 50 over a semester. The decrease in pedestrian deaths is Vision Zero’s main priority. Before Vision Zero, 72 pedestrians died in car accidents during the first semester of 2013, four years later, during the first semester of 2017, this number decreased by 47% to 49.
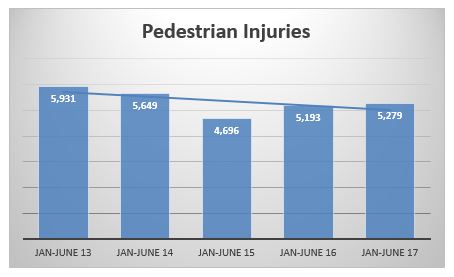
Pedestrian injuries are also on a declining trend. They were at their lowest during the first semester of 2015. Since then they increased again but they are still below the level recorded before the introduction of Vision Zero. The global trend is declining since 2013.
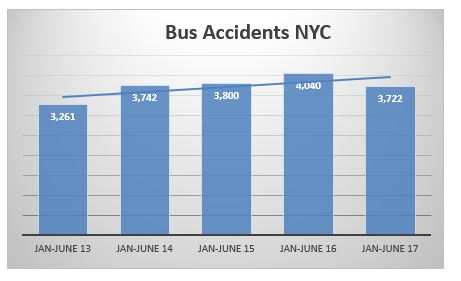
There were 3,722 bus accidents during the first semester of 2017 compared to respectively 4,040, 3,800, 3,742 and 3,261 during the same period of 2016, 2015, 2014 and 2013. Despite a decline during the first semester of 2017, more bus accidents were reported to the police during the Vision Zero program than before.
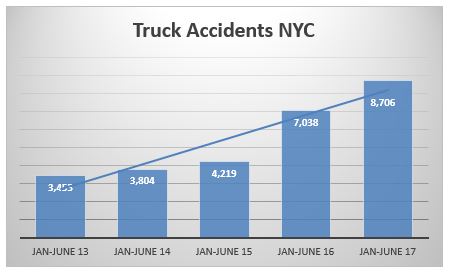
Truck accidents in New York City continue to increase dramatically. The number of truck accidents in New York City during this year’s first semester increased by more than 150% compared to the first semester of 2013. 8,706 truck accidents were reported during the first semester of 2017 compared to respectively 7,038, 4,219, 3,804, and 3,455 during the same period of 2016, 2015, 2014 and 2013.