A New York cyclist suffered serious personal injury after being struck by a bus this morning on the Hudson River Greenway in Hells’ Kitchen


A cyclist was seriously inured after he collided with a NY Waterway Bus that was crossing the Hudson River Greenway to go to the 39th Street ferry terminal this morning. The Hudson River Greenway is an 11 mile bike and pedestrian path along the Hudson River that stretches from Battery Park at the South of Manhattan to the Georges Washington Bridge at the North. Many New Yorkers use it to commute to work every day. Several busy driveways leading to various piers, parking and commercial operations cross the Greenway around 40th street making this area one of the most dangerous on the Greenway.
A few years ago, our firm represented the widow of a doctor who died two streets below Today’s accident after being struck by a NYPD tow truck driver who failed to yield.
Another cyclist died after being struck by a drunk driver who drove onto the Greenway from a Chelsea Piers parking lot.
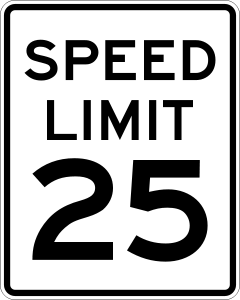 A major step in Vision Zero plan to reduce the number of injury and death related to traffic accidents in New York City has been achieved this week. Albany just granted Bill deBlasio the authority to reduce the maximum speed limit from 30 mph to 25mph in all 5 boroughs of New York City.
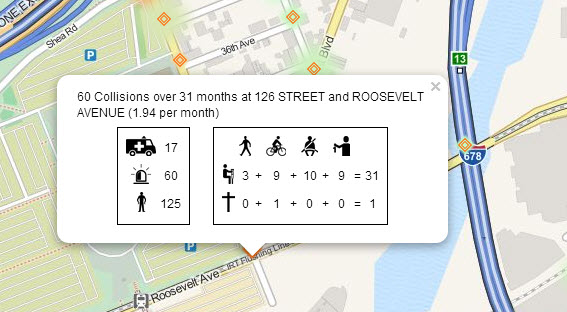
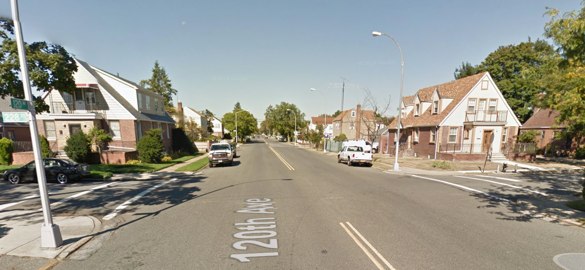
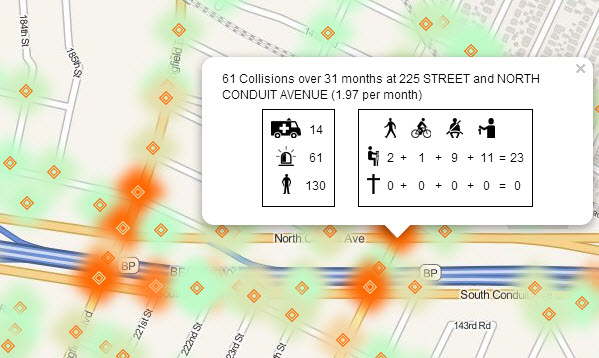 The second accident happened at the intersection of 130 Street and N. Conduit Ave which is also an intersection with a high rate of accidents. According to NYC Crashmapper, over the last 31 months, 64 collisions happened at this intersection. 148 people were involved. 1 pedestrian, 1 cyclist, 15 passengers and 12 drivers suffered personal injury.