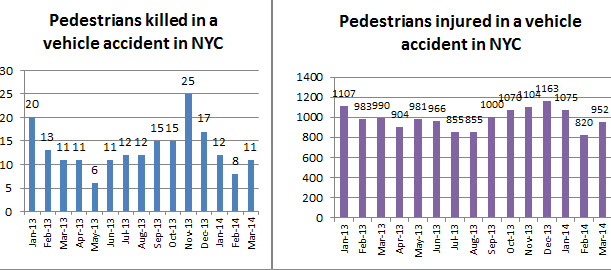
In New York City, the number of pedestrians killed in traffic accidents last March was 11, the same number as in March 2013


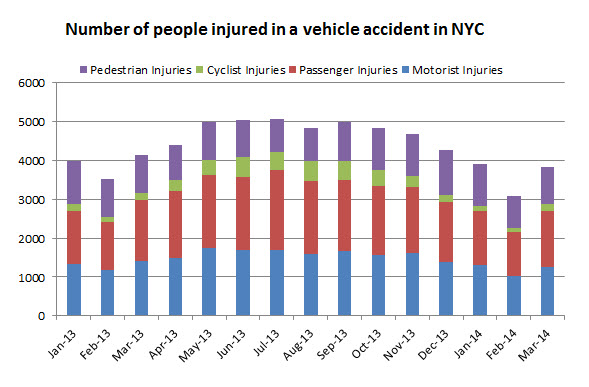
It’s too early to say if the first Vision Zero measures to reduce traffic fatalities are effective yet. After a decrease of the number of people injured or killed in vehicle accidents in New York last February, the numbers are up again for March 2014 and are pretty much at the same level as they were a year ago according to the most recent statistics from the NYPD
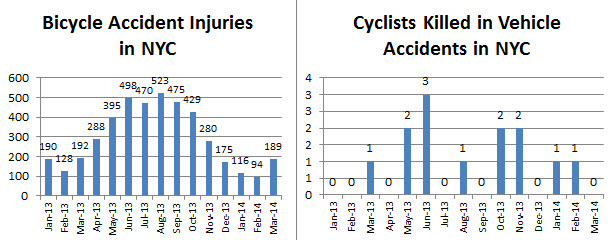
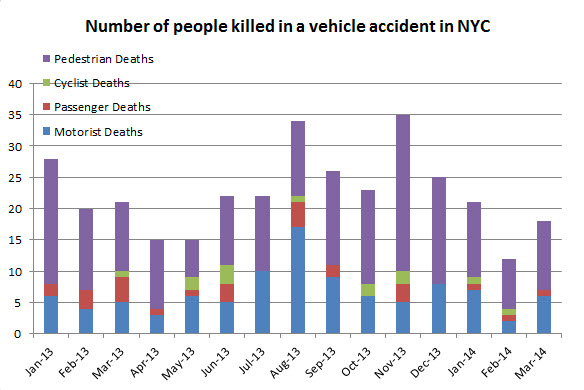 The number of pedestriandeaths, 11, is exactly the same in March this year than it was in March last year. 952 pedestrians were injured in auto accident this march compared to 990 in March 2013 and 820 the month before. The number of bicyclists injured was also pretty much the same from one year to the other.
 Bus Accidents were slightly on the rise from one year to the other with 572 accidents in March 2014 compared to 523 in March 2013.

 Today we are looking at fatal pedestrian and bicycle accidents in New York and in the US.This is part 3 of of our series on the Walking and Bicycling Alliance 2014 Benchmarking report.
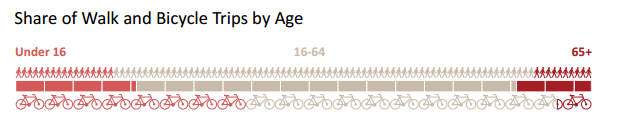 Most people walk or use their bike for a social or recreational reason however more and more people are using their bikes to go to work especially in large cities where the combined average share of commuters by bicycle and foot is significantly higher at nearly 6.1% (1.0% bicycling and 5.0% walking) compared to an average of 3.4% nationally.
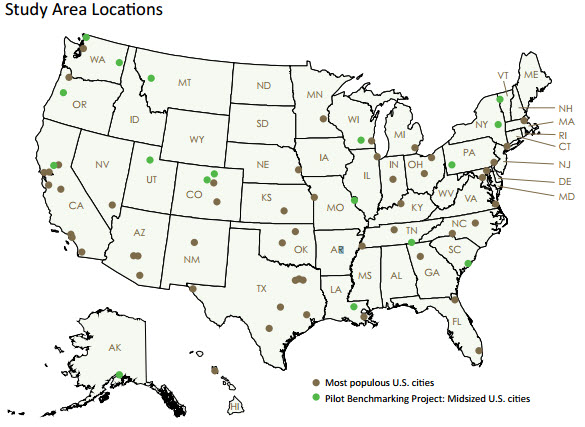 Globally the report shows a slow but steady increase of people using their bikes or their feet to go to work. The report also demonstrates that the level of pedestrian and bicycle accidents is inversely proportional to the number of bikers and walkers and that advocacy groups are playing an important role encouraging people to do so.